
| Mean (95% CI) | Std. Error | Median | SD | Range | |
|---|---|---|---|---|---|
| Age | 36.45 (33.88 - 39.02) | 1.30 | 28.5 | 15.5 | 18 - 77 |
| CFC-F | 32.36 (31.00 - 33.76) | 0.71 | 33 | 8.28 | 7 - 49 |
| CFC-I | 26.17 (24.82 - 27.53) | 0.69 | 26 | 8.22 | 6 - 49 |
| Procrastination | 34.76 (32.83 - 36.68) | 0.97 | 35 | 11.57 | 12 - 60 |
Do Perceptions of Remaining Life Shape Procrastination? Evidence from Latent Class and Bayesian Models
Abstract
Procrastination is linked to temporal orientation, with stronger future orientation typically associated with lower procrastination. However, it remains unclear whether subjective remaining life is associated with procrastination. This study examined associations between temporal orientation, subjective remaining life, and procrastination in a sample of 140 adults aged 18–77. Latent class analysis identified two temporal profiles: a high future orientation group (46.43%) and a neutral orientation group (53.37%). Bayesian regression indicated that higher subjective remaining life was likely associated with greater procrastination, although the effect was modest. In contrast, future orientation showed a clear negative association with procrastination. These findings suggest that subjective remaining life may function as a contextual factor, whereas temporal orientation represents a more robust correlate of procrastination.
Keywords
time perception, life expectancy, decision making, latent class analysis
Method
Design and sample
This is an analysis of cross-sectional survey data recruited through both convenience and snowball sampling methods. The initial sample comprised \(229\) respondents. However, \(90\) respondents were excluded from analysis due to either high levels of missing data across all variables (\(\ge 80\%\) missingness; \(n = 87\)) or missing data in key covariates (\(n = 3\)). As such, the final analytic sample comprised \(140\) respondents.
Measures
Predictor: Consideration of Future Consequences
Consideration of future consequences (CFC) was assessed using the CFC-14 scale (Joireman et al., 2012). This scale consists of two 7-item subscales: CFC-Future (CFC-F) and CFC-Immediate (CFC-I) (Joireman et al., 2008), Items are measured on a 7-point Likert scale ranging from 1 (not at all like me) to 7 (very much like me). Subscale scores (range: 7-49) were computed by summing the respective items, and a total CFC score (range: 14-98) was calculated by reverse-scoring CFC-I items and combining them with CFC-F. Within this sample, the reliability of both subscales was strong, with Cronbach’s \(\alpha\) values of 0.85 for CFC-F and 0.81 for CFC-I. An example item from the CFC-F subscale includes, “I am willing to sacrifice my immediate happiness or well-being in order to achieve future outcomes”, while an example item from the CFC-I subscale includes, “I think that sacrificing now is usually unnecessary since future outcomes can be dealt with at a later time”.
Predictor: Subjective Remaining Life
Subjective remaining life (SRL) was operationalised following established approaches in lifespan and ageing research (Kornadt et al., 2018). SRL was calculated as the difference between participants’ subjective life expectancy and their current age, with higher values indicating a perception of having more remaining lifetime. Subjective life expectancy was assessed using two questions adapted from the Healthy AGeing in Scotland study (Douglas et al., 2018). Participants first estimated the average life expectancy of others their age and sex, then provided their own life expectancy.
Outcome: Procrastination
Procrastination was measured using the Pure Procrastination Scale (PPS; Steel (2010)). Each item is measured on a 5-point Likert scale ranging from 1 (strongly disagree) to 5 (strongly agree). A composite procrastination score (range: 12-60) is calculated by summing each item. In this sample, the PPS demonstrated strong reliability with a Cronbach’s \(\alpha\) score of 0.90. An example of an item from the scale includes “I delay making decisions until it’s too late”.
Covariates
Three covariates, sex, presence of a chronic illness, and self-rated general health were included in the analysis based on a priori knowledge of their associations with procrastination and self-regulatory behaviour (Sirois, 2015; Steel & Ferrari, 2013). All covariates were dichotomized such that: sex (0 = male, 1 = female), chronic illness (0 = absent, 1 = present), and self-rated general health (0 = poor health, 1 = good health).
Procedure
The study was approved by the university’s departmental review board. Participation in the study was both voluntary and anonymous. Participants provided informed consent before completing the online survey, which was administered via Qualtrics, ensuring secure data handling through encryption and compliance with data protection standards.
Data Analysis
All data analysis was carried out using R (version 4.5.2; R Core Team (2025)).
Latent class analysis
A latent class analysis (LCA) was conducted to identify unobserved heterogeneity in respondents’ temporal orientation based on their response patterns to the CFC-14 item. LCA is a model-based clustering approach for categorical data that assumes the observed multivariate distribution arises from a finite mixture of latent subpopulations, each characterised by distinct response probabilities across the observed indicators (Kaplan, 2008; Sinha et al., 2021).
To facilitate estimation and address insufficient degrees of freedom associated with the full seven-point response scale, CFC-14 items were trichotomized prior to analysis. Responses ranging from 1 – 3 (representing negatively worded answers) were recoded as 1. The response 4, representing neither agreement nor disagreement was recoded as 2. Finally, responses ranging from 5 – 7 (representing positively worded answers) were recoded as 3. For a mathematical justification of this trichotomization, please see the appendix.
LCA was performed using the PoLCA package (Linzer & Lewis, 2011). A series of models with a number of latent classes ranging from \(R \in {1, 2, 3, 4}\) were fit. Following recommendations to mitigate convergence on local maxima (Meijer et al., 2022), each model was estimated with a maximum of 3,000 iterations and 100 random starting values. Model fit was assessed primarily by the Bayesian Information Criterion (BIC), which has been shown to perform well in latent class settings (Linzer & Lewis, 2011; Van Lissa et al., 2024), alongside normalised entropy as an index of classification certainty. Entropy values exceeding 0.80 were interpreted as indicating adequate separation between latent classes (Meijer et al., 2022). Rather than assigning individuals to classes using modal posterior probabilities, posterior class membership probabilities were retained and propagated into subsequent analyses. This approach explicitly accounts for classification uncertainty and avoids bias associated with treating latent class membership as an observed variable (see Asparouhov & Muthén (2014)).
Bayesian regression
Associations between temporal orientation, subjective remaining life, and procrastination were examined using Bayesian regression models implemented in JAGS via the R2jags package (Yu-Sung & Masanao, 2024). Posterior class probabilities from the LCA were used to propagate latent class uncertainty. Specifically, each participant’s class membership was treated as a Bernoulli variable with success probability equal to their posterior probability of being in the non-reference class \((\pi_i)\). This allowed the model to integrate uncertainty in class assignment directly into the regression.
The regression model included latent class membership, subjective remaining life (mean-centred), and their interaction (a product term) as predictors, along with sex, self-rated general health, and chronic illness status as covariates. Statistically, let \(Y_i\) be the observed response variable for individual \(i\). We assume the following:
\[ \begin{align*} y_i \sim \; &\mathcal{N}(\mu_i, \sigma^2) \\[4pt] \mu_i \sim \; &\beta_0 + \beta_1\text{Class}_i + \beta_2\text{SRL}_i + \beta_3\text{Class}_i \times \text{SRL}_i \; + \\[2pt] &\beta_4\text{Sex}_i + \beta_5\text{General Health}_i + \beta_6\text{Chronic Illness}_i \\[4pt] \text{Class}_i \sim \; &\text{Bernoulli}(\pi_i) \end{align*} \]
Weakly informative normal priors were placed on all regression coefficients, and a half-\(t\) prior was specified for the residual standard deviation.
\[ \beta_k \sim \mathcal{N}(0, 100^2), \quad k = 0, \dots, 6, \quad \sigma \sim \text{half-t}(0, 100, 1). \]
Results
Our final analytic sample comprised 140 respondents with the following age distribution: 18-24 (\(n = 48\)), 25-44 (\(n = 46\)), and 45+ (\(n = 46\)). Of these 140 respondents, \(68.57\% \; (n = 96)\) were female, \(35.00\% \; (n = 49)\) had a chronic illness, and \(92.14\% \; (n = 129)\) rated their health as good. Descriptive statistics for all continuous variables were generated and are presented below in Table 1.
Latent class analysis
To determine a respondent’s temporal orientation, we ran four latent class models and presented model fit indices for all four models in Table 2. The two-class model showed lower BIC values compared to all other \(R\)-class models, indicating improved fit. Additionally, the entropy value exceeded 0.80, suggesting clear class separation. Overall, the two-class model demonstrated a strong balance between model complexity and fit and the fit metrics are highlighted in bold.
| Model | k | Log(L) | BIC | Entropy | Probability of class |
|---|---|---|---|---|---|
| Note. k = Number of free parameters; Log(L) = Log-likelihood value; BIC = Bayesian Information Criterion; | |||||
| 1 class | 28 | -1920.06 | 3978.48 | NA | |
| 2 classes | 57 | -1728.25 | 3738.18 | 0.91 | 0.536 / 0.464 |
| 3 classes | 86 | -1666.62 | 3758.23 | 0.95 | 0.436 / 0.421 / 0.143 |
| 4 classes | 115 | -1625.76 | 3819.81 | 0.96 | 0.143 / 0.457 / 0.271 / 0.129 |
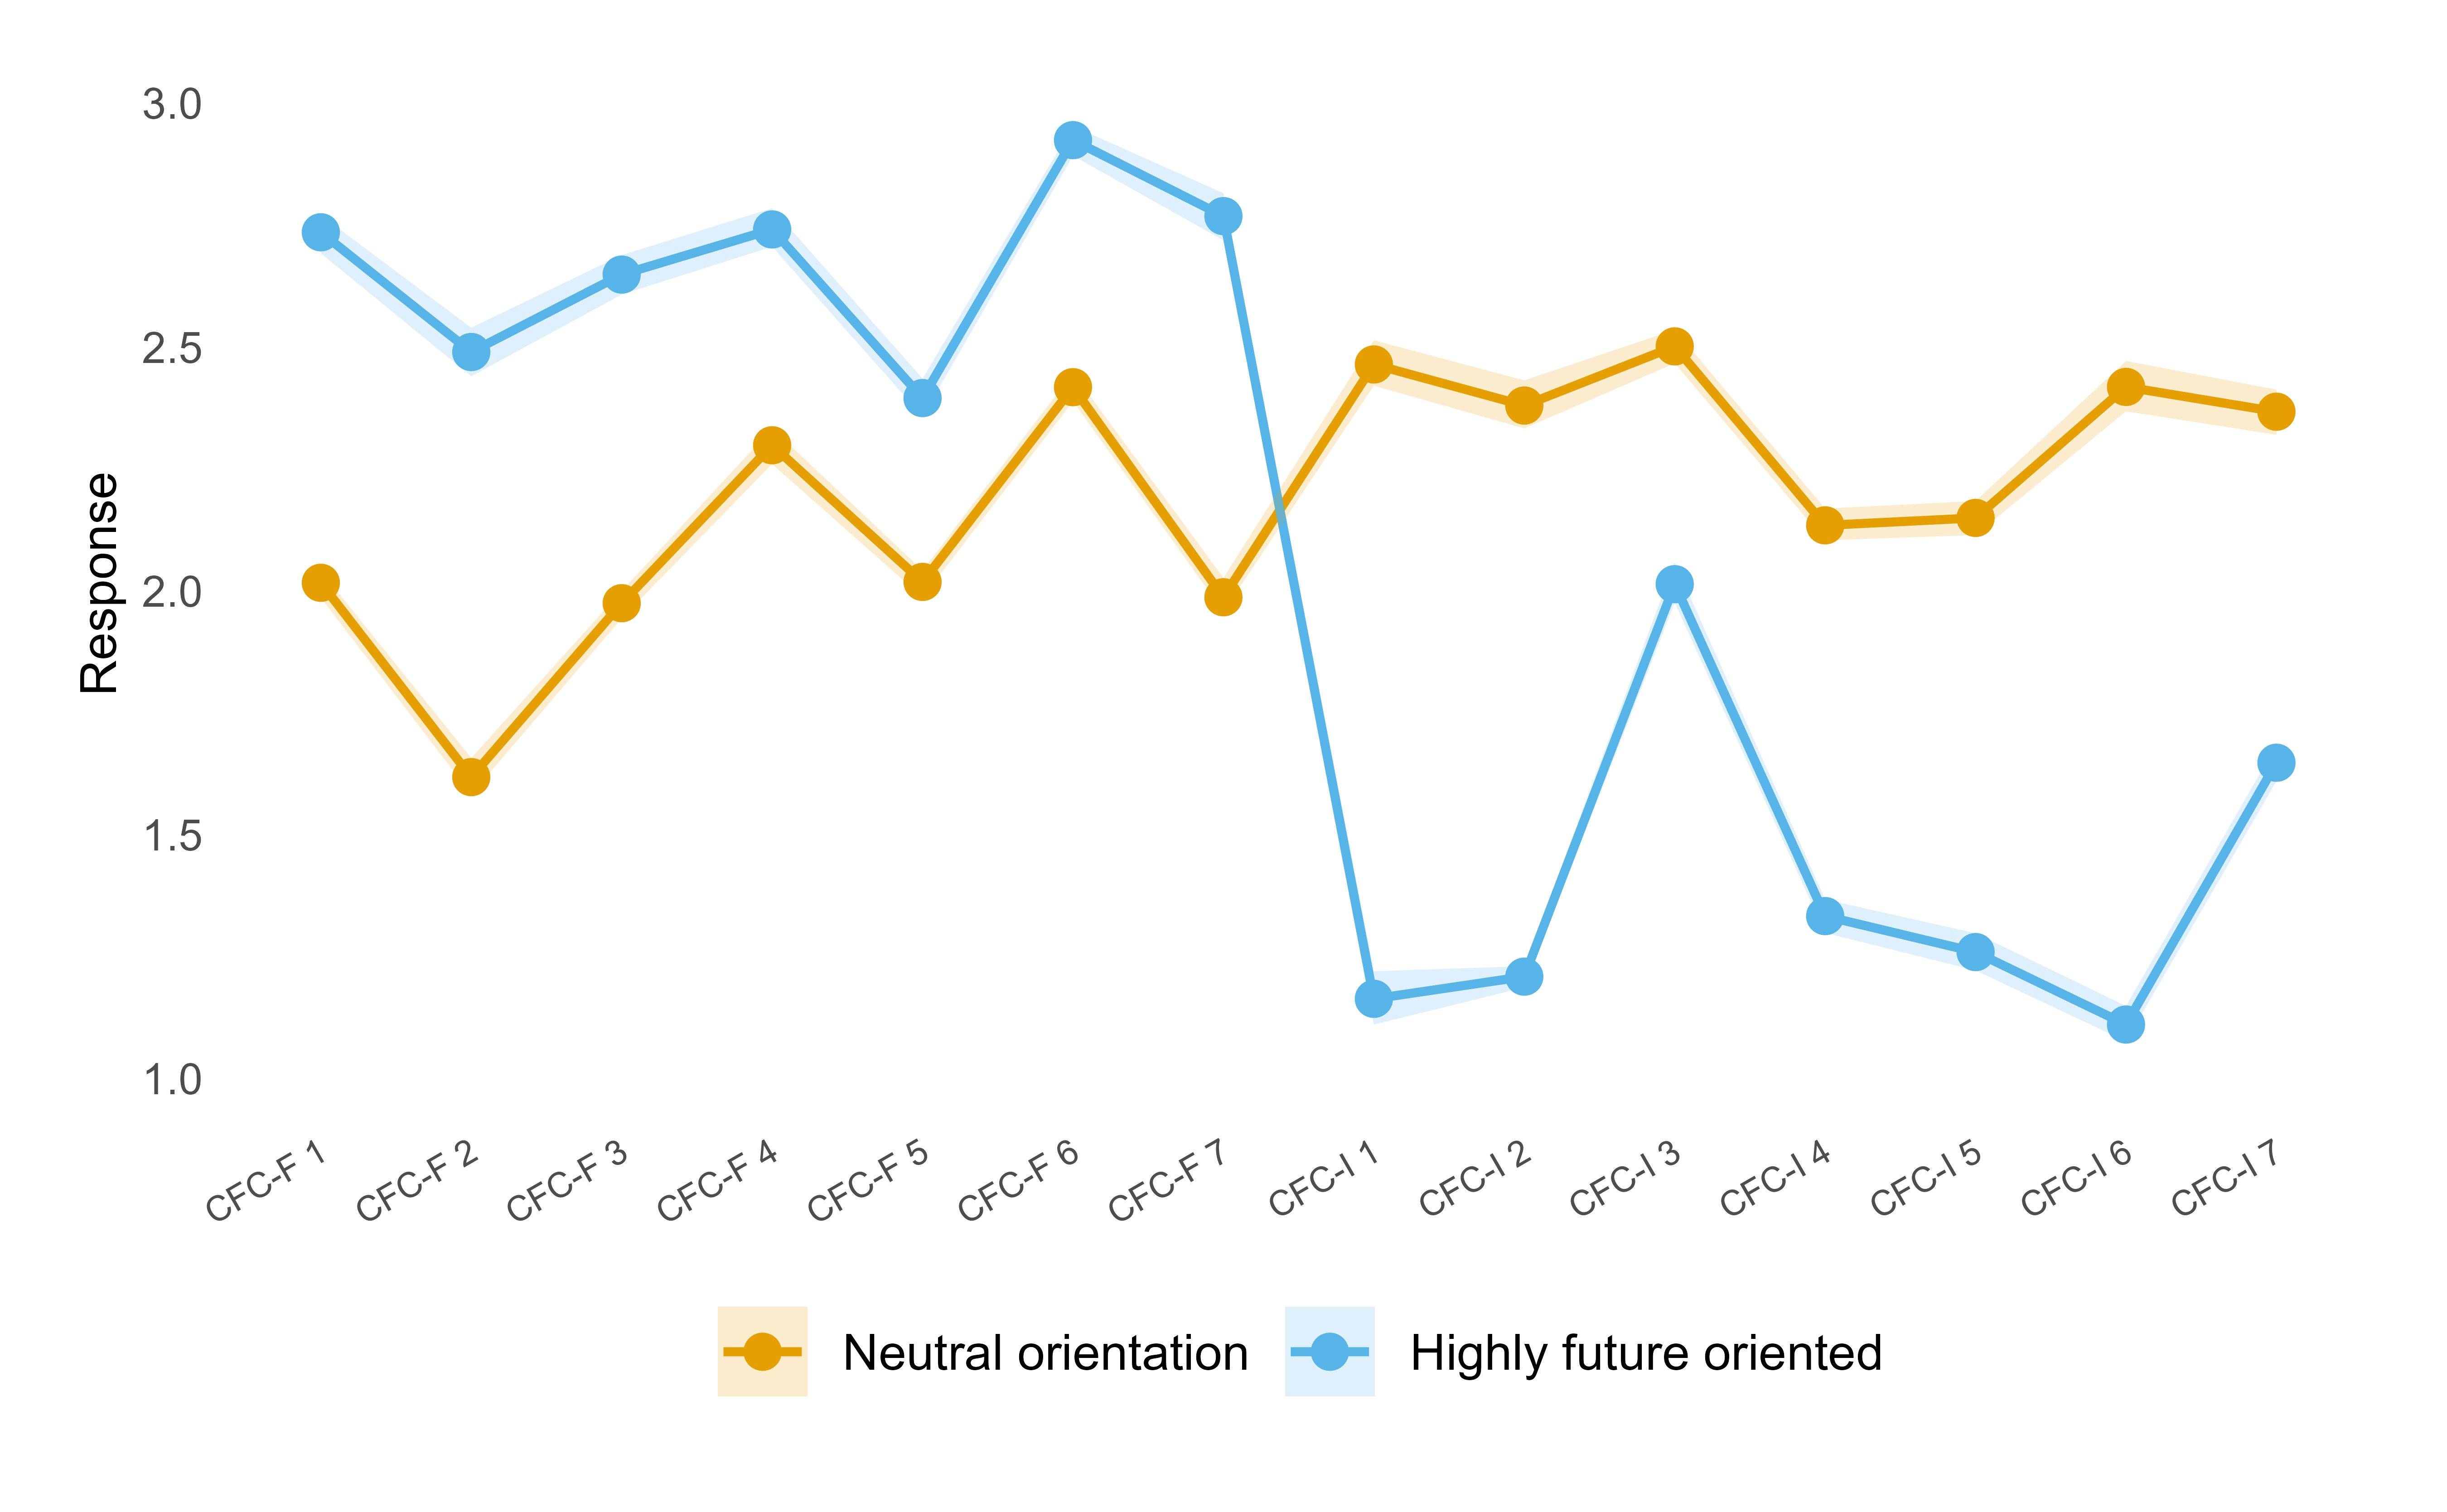
Figure 1 displays posterior-averaged item-response profiles for the two latent classes. For each class, mean item responses were averaged across 500 posterior draws of class membership, with shaded bands indicating 95% posterior credible intervals. One class, comprising 45.1% of respondents (\(n = 64\)), showed consistently higher responses on CFC-Future items and lower responses on CFC-Immediate items, indicating a strong emphasis on future consequences. This class was labelled the high future, low immediate orientation group. The second class, comprising 54.9% of respondents (\(n = 79\)), exhibited relatively flat and mid-range responses across both subscales, suggesting neither a pronounced future nor immediate oriented temporal focus. As a result, this class was labelled the neutral orientation group.
Bayesian regression
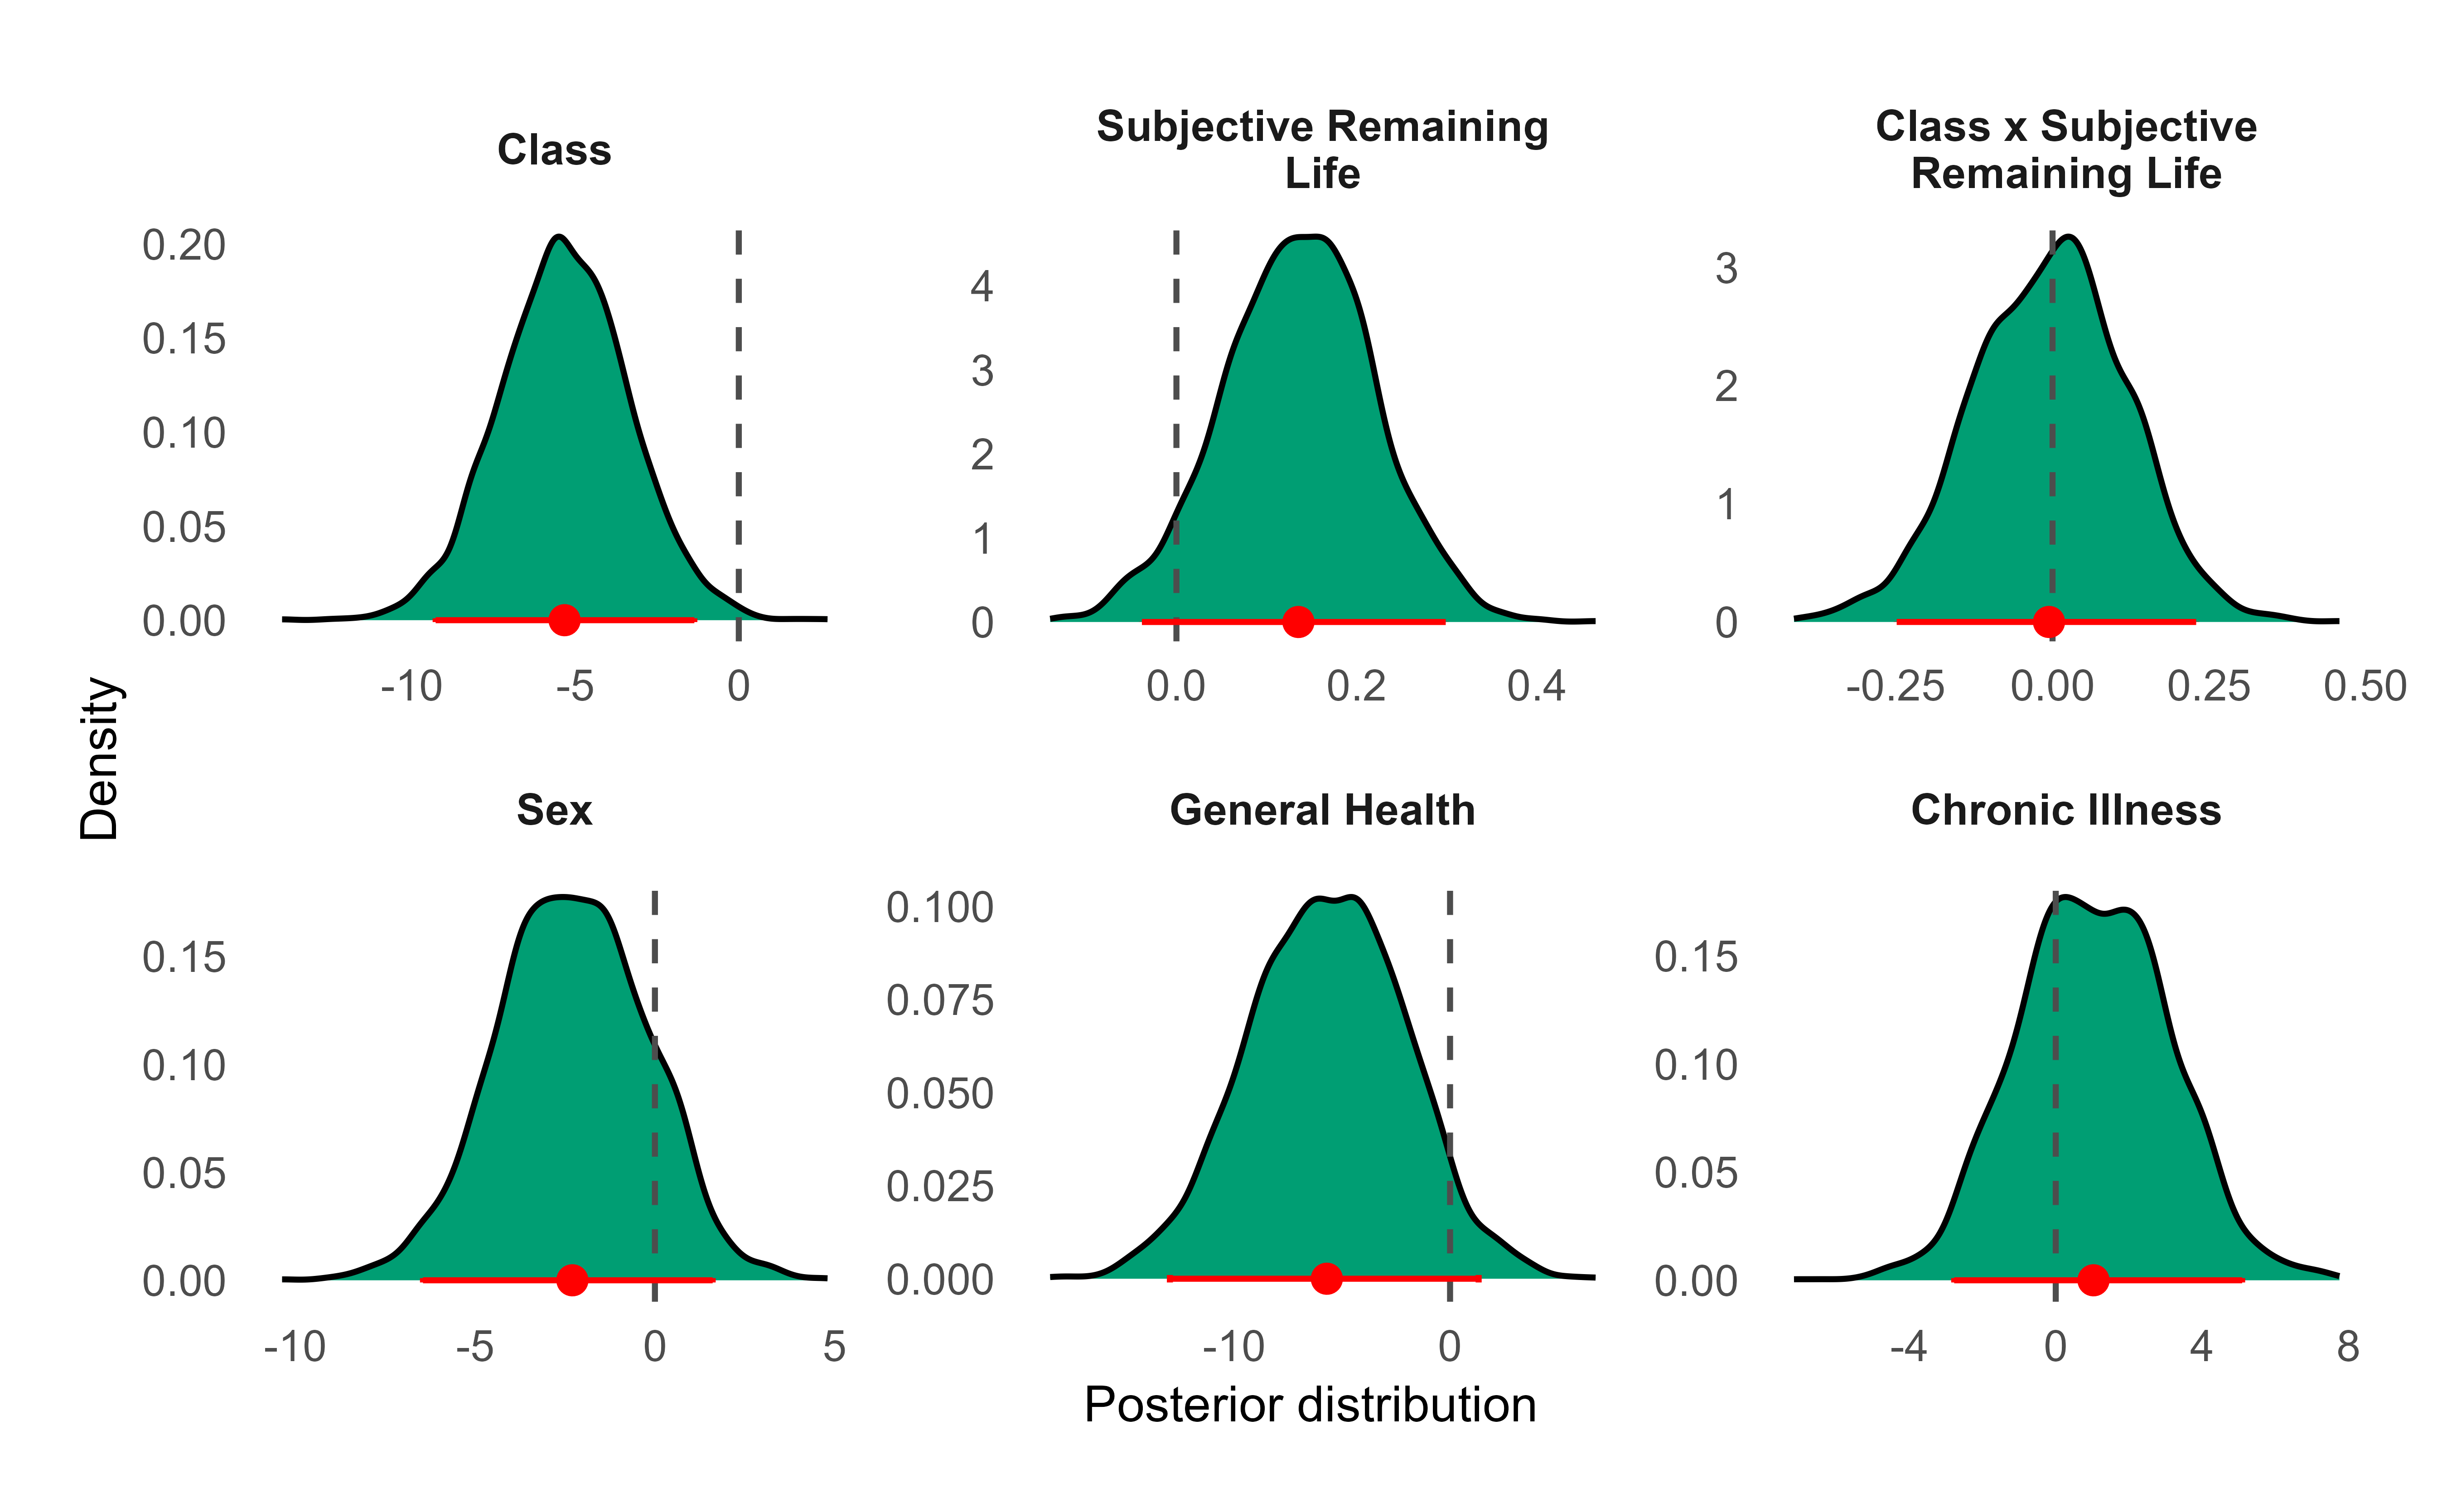
Posterior distributions for all regression parameters are reported in Figure 2. For each parameter, the figure displays the posterior mean, 95% credible interval, and full posterior density, with estimates derived from the pooled posterior draws of the Bayesian regression model incorporating latent class uncertainty.
Across most predictors, posterior estimates were modest in magnitude and characterised by substantial uncertainty. The interaction between temporal orientation class and subjective remaining life was close to zero and highly uncertain \((\beta = -0.01 \; [-0.25, 0.23])\). In contrast, the main effect for subjective remaining life showed a small positive association with procrastination \((\beta = 0.14 \; [-0.04, 0.30])\). Although the 95% credible interval overlapped zero, approximately 94% of posterior samples were greater than zero (see Figure 2), indicating moderate evidence for a positive association. Additionally, temporal orientation (i.e., class) exhibited a negative main effect on procrastination \((\beta = -5.33 \; [-9.28, -1.23])\) suggesting that individuals with a stronger future orientation tended to report lower procrastination scores.
With regard to the covariates, the effects for both sex \((\beta = -2.29 \; [-6.35, 1.61])\) and chronic illness \((\beta = 1.03 \; [-2.78, 5.09]\) were highly uncertain. In contrast, general health showed a moderate negative association with procrastination \((\beta = -5.71 \; [-13.00, 1.32])\) with approximately 95% of the posterior samples being less than zero, suggesting that those with reported good health tended to report lower procrastinations. However, the relative abundance of respondents who reported poor health \(7.69\% (n = 11)\) versus good health \(92.31\% (n = 129)\) warrants caution in interpretation.
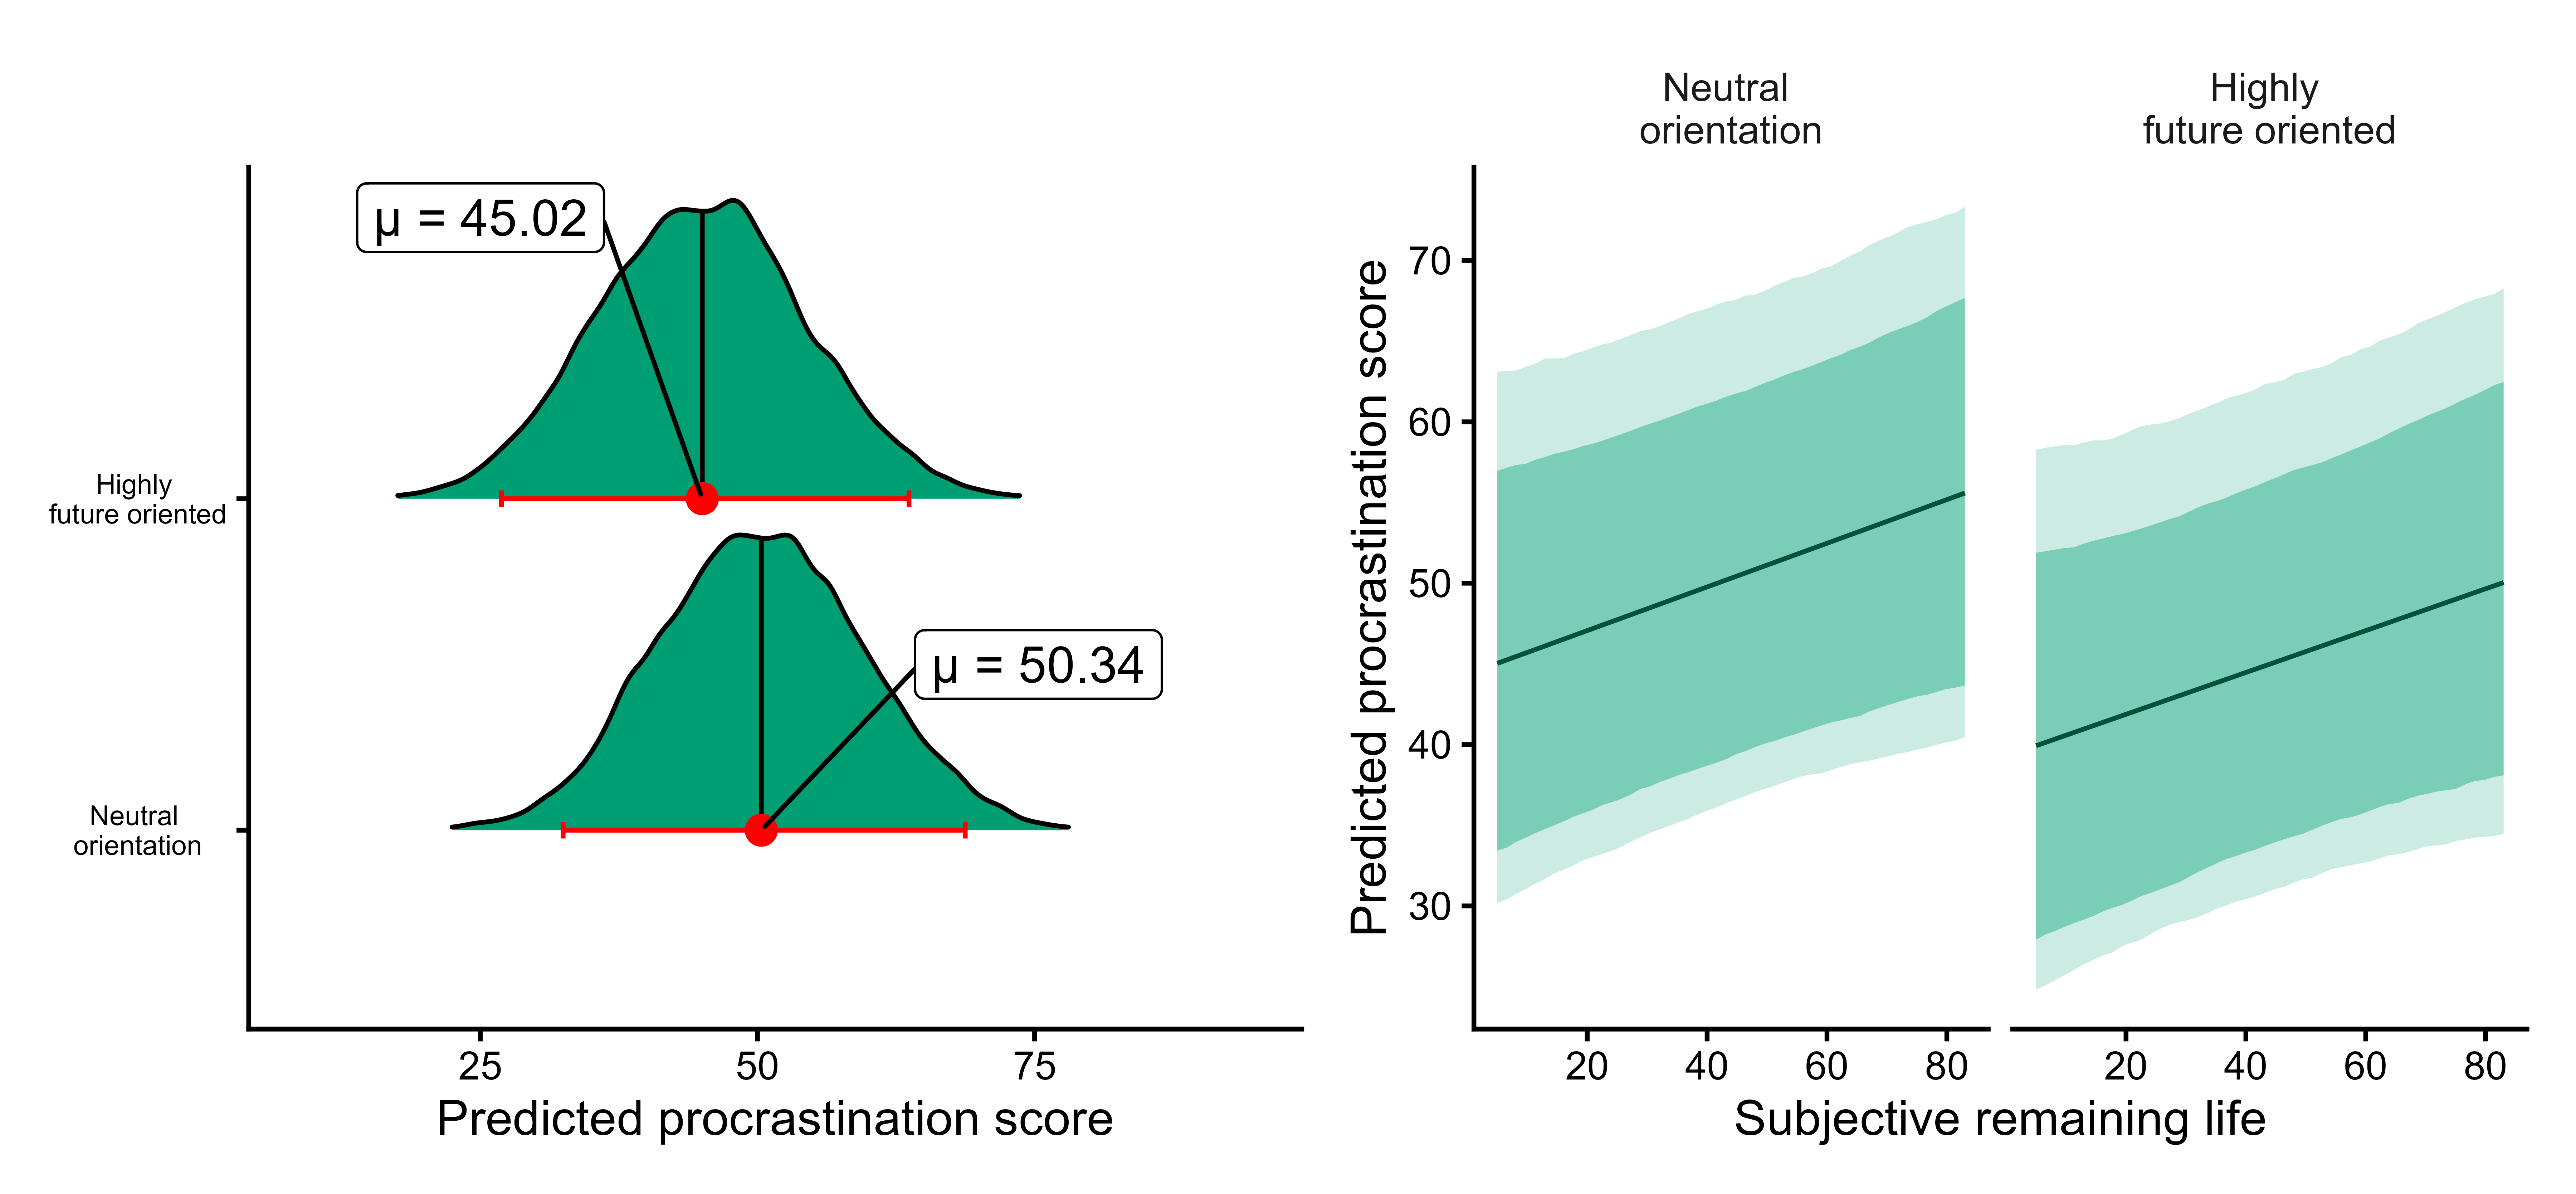
Consistent with these results, Figure 3 presents posterior predictive distributions of procrastination scores for both temporal orientation class (left panel) and subjective remaining life (right panel). While predicted procrastination scores were lower for individuals with a stronger future orientation (left panel), this difference had no meaningful effect on procrastination scores across subjective remaining life scores (right panel).
Discussion
While previous research has explored the temporal nature of procrastination (Rebetez et al., 2016; Sirois, 2004; Specter & Ferrari, 2000), no study has examined this nature across the lifespan, with a specific focus on subjective remaining life. Temporal orientation (how individuals perceive time) plays a significant role in shaping behaviour (Boyd & Zimbardo, 2012; Zimbardo & Boyd, 2014). Although studies such as those by Rebetez et al. (2016) highlight the role of future orientation in reducing procrastination, the intersection of temporal orientation and subjective remaining life (how much time one feels they have left) remains unexplored. Therefore, this study examined whether subjective remaining life was associated with procrastination, and whether it moderated the relationship between temporal orientation and procrastination.
Latent class analysis identified two distinct temporal orientation classes: a “high future orientation” group and a “neutral orientation” group. In line with prior research (Rebetez et al., 2016; Sirois et al., 2014), temporal orientation showed a credible negative association with procrastination, such that individuals with a stronger future orientation reported lower procrastination scores (see Figure 3). Moreover, when it came to subjective remaining life, the results were more nuanced. Consistent with our hypothesis, the posterior mean suggested a positive association between subjective remaining life and procrastination, with approximately 94% of posterior samples indicated an effect in this direction. Although the magnitude of this association was modest and accompanied by interval uncertainty, the directional probability provides moderate evidence that perceiving more time left to live may be associated with greater procrastination.
Such results suggest that perceiving an expansive time horizon may reduce perceived urgency to act, thereby increasing susceptibility to delay. Individuals who perceive ample time remaining in life may feel less immediate pressure to act, reinforcing the tendency to defer effortful or aversive tasks to a future self. In this sense, subjective remaining life may contribute to the temporal misalignment that characterises procrastination (Borawski et al., 2026; Sirois & Pychyl, 2013). However, subjective remaining life did not appear to moderate the association between temporal orientation and procrastination. As seen from Figure 2, the posterior estimates for the interaction term were largely centred near zero. Moreover, predicted procrastination scores were broadly similar across levels of subjective remaining life within both temporal orientation classes (see Figure 3). Overall, the lack on an interaction effect and relatively small main effect size \((\beta = 0.14)\) suggests that rather than acting as a dominant motivational factor, subjective remaining life may operate as a contextual factor that shapes how urgently future consequences are experienced. More broadly, procrastination be more strongly shaped by self-regulatory capacity, task characteristics, and personality traits such as conscientiousness (Meng et al., 2024; Sirois & Pychyl, 2013; Steel, 2007).
Taken together, these results tentatively suggest that perceiving a longer remaining lifetime may be associated with greater procrastination. However, from a Bayesian perspective, such an association is modest and warrants further investigation. Further research, particularly using longitudinal or experimental designs, is needed to determine whether changes in perceived remaining time translate into measurable shifts in procrastinatory behaviour. More importantly, while the present findings suggest that subjective remaining life may play a role in procrastination, this role is considerably weaker than that of stable future-oriented dispositions.
Limitations and future directions
Several limitations should be acknowledged. First, the cross-sectional nature of this study precludes causal inference and limits conclusions about temporal dynamics between subjective remaining life and procrastination. Longitudinal designs would be particularly valuable for examining whether changes in perceived time are associated with within-person changes in procrastination. Second, the relatively small sample size \((n = 140)\) and use use of convenience sampling restricts generalisability. Although the sample spanned a wide age range \((18 - 77)\), future research should aim to replicate these findings in both larger and more representative samples.
Moreover, our usage of the Pure Procrastination Scale (Steel, 2010) does not distinguish between different procrastination processes or task domains, but rather general procrastination tendencies. Future studies may benefit from examining domain-specific procrastination or task-level behaviour, particularly in contexts where future time perspectives are more salient (e.g., health decisions, retirement planning, or emotionally meaningful goals). Finally, future work should consider the role of individual differences such as conscientiousness, emotion regulation, and self-control (Meng et al., 2024; Steel, 2007), which may mediate or overshadow the effects of temporal orientation and subjective remaining life on procrastination.
Conclusions
This study examined whether subjective remaining life shapes the relationship between temporal orientation and procrastination. Using latent class analysis and Bayesian regression, we found strong evidence that stronger future orientation is associated with lower procrastination. Subjective remaining life showed moderate evidence of a small positive association with procrastination but did not moderate the relationship between temporal orientation and procrastination. Overall, these findings suggest that stable temporal orientation may play a more substantial role in procrastination than subjective perceptions of remaining life time.
References
Asparouhov, T., & Muthén, B. (2014). Auxiliary Variables in Mixture Modeling: Three-Step Approaches Using Mplus. Structural Equation Modeling: A Multidisciplinary Journal, 21(3), 329–341. https://doi.org/10.1080/10705511.2014.915181
Blunt, A., & Pychyl, T. A. (2005). Project systems of procrastinators: A personal project-analytic and action control perspective. Personality and Individual Differences, 38(8), 1771–1780. https://doi.org/10.1016/j.paid.2004.11.019
Borawski, D., Rozpara, B., & Ginalska, K. (2026). When time matters: The moderating role of time perspectives in the relationship between neuroticism and procrastination. Personality and Individual Differences, 253, 113618. https://doi.org/10.1016/j.paid.2025.113618
Boyd, J., & Zimbardo, P. (2012). The time paradox: Using the new psychology of time to your advantage. Random House.
Carstensen, L. L. (2001). Selectivity theory: Social activity in life-span context. Families in Later Life, 22, 265–275.
Díaz-Morales, J. F., & Ferrari, J. R. (2015). More Time to Procrastinators: The Role of Time Perspective. In M. Stolarski, N. Fieulaine, & W. van Beek (Eds.), Time Perspective Theory; Review, Research and Application: Essays in Honor of Philip G. Zimbardo (pp. 305–321). Springer International Publishing. https://doi.org/10.1007/978-3-319-07368-2_20
Dı́az-Morales, J. F., Ferrari, J. R., & Cohen, J. R. (2008). Indecision and avoidant procrastination: The role of morningness—eveningness and time perspective in chronic delay lifestyles. The Journal of General Psychology, 135(3), 228–240. https://doi.org/10.3200/GENP.135.3.228-240
Douglas, E., Rutherford, A., & Bell, D. (2018). Pilot study protocol to inform a future longitudinal study of ageing using linked administrative data: Healthy AGeing in scotland (HAGIS). BMJ Open, 8(1), e018802. https://doi.org/10.1136/bmjopen-2017-018802
Fee, R. L., & Tangney, J. P. (2000). Procrastination: A means of avoiding shame or guilt? Journal of Social Behavior & Personality, 15(5).
Ferrari, J. R., & Dı́az-Morales, J. F. (2007). Procrastination: Different time orientations reflect different motives. Journal of Research in Personality, 41(3), 707–714. https://doi.org/10.1016/j.jrp.2006.06.006
Hasmanová Marhánková, J., & Soares Moura, E. (2024). “What can I plan at this age?” Expectations regarding future and planning in older age. Sociological Research Online, 29(1), 120–136.
Joireman, J., Balliet, D., Sprott, D., Spangenberg, E., & Schultz, J. (2008). Consideration of future consequences, ego-depletion, and self-control: Support for distinguishing between CFC-immediate and CFC-future sub-scales. Personality and Individual Differences, 45(1), 15–21. https://doi.org/10.1016/j.paid.2008.02.011
Joireman, J., Shaffer, M. J., Balliet, D., & Strathman, A. (2012). Promotion orientation explains why future-oriented people exercise and eat healthy: Evidence from the two-factor consideration of future consequences-14 scale. Personality and Social Psychology Bulletin, 38(10), 1272–1287. https://doi.org/10.1177/0146167212449362
Joireman, J., Sprott, D. E., & Spangenberg, E. R. (2005). Fiscal responsibility and the consideration of future consequences. Personality and Individual Differences, 39(6), 1159–1168. https://doi.org/10.1016/j.paid.2005.05.002
Kaftan, O. J., & Freund, A. M. (2018). A motivational life-span perspective on procrastination: The development of delaying goal pursuit across adulthood. Research in Human Development, 15(3-4), 252–264. https://doi.org/10.1080/15427609.2018.1489096
Kaplan, D. (2008). Structural equation modeling: Foundations and extensions (Vol. 10). SAGE publications.
Klingsieck, K. B. (2013). Procrastination. European Psychologist. https://doi.org/10.1027/1016-9040/a000138
Kornadt, A. E., Voss, P., & Rothermund, K. (2018). Subjective remaining lifetime and concreteness of the future as differential predictors of preparation for age-related changes. European Journal of Ageing, 15, 67–76. https://doi.org/10.1007/s10433-017-0426-3
Linzer, D. A., & Lewis, J. B. (2011). poLCA: An r package for polytomous variable latent class analysis. Journal of Statistical Software, 42, 1–29. https://doi.org/10.18637/jss.v042.i10
McCown, B., Blake, I. K., & Keiser, R. (2012). Content analyses of the beliefs of academic procrastinators. Journal of Rational-Emotive & Cognitive-Behavior Therapy, 30, 213–222. https://doi.org/10.1007/s10942-012-0148-6
Meijer, E., Gebhardt, W., Laar, C. van, Chavannes, N., & Putte, B. van den. (2022). Identified or conflicted: A latent class and regression tree analysis explaining how identity constructs cluster within smokers. BMC Psychology, 10(1), 231. https://doi.org/10.1186/s40359-022-00937-y
Meng, X., Pan, Y., & Li, C. (2024). Portraits of procrastinators: A meta-analysis of personality and procrastination. Personality and Individual Differences, 218, 112490. https://doi.org/10.1016/j.paid.2023.112490
Milfont, T. L., & Schwarzenthal, M. (2014). Explaining why larks are future-oriented and owls are present-oriented: Self-control mediates the chronotype–time perspective relationships. Chronobiology International, 31(4), 581–588. https://doi.org/10.3109/07420528.2013.876428
Monaghan, C., de Andrade Moral, Rafael, & McHugh Power, J. (2025). Procrastination and preventive health-care in the older U.S. population. Preventive Medicine, 190, 108185. https://doi.org/10.1016/j.ypmed.2024.108185
R Core Team. (2025). R: A language and environment for statistical computing. R Foundation for Statistical Computing. https://www.R-project.org/
Rebetez, M. M. L., Barsics, C., Rochat, L., D’Argembeau, A., & Van der Linden, M. (2016). Procrastination, consideration of future consequences, and episodic future thinking. Consciousness and Cognition, 42, 286–292. https://doi.org/10.1016/j.concog.2016.04.003
Shah, R., & Mukherjee, A. (2025, June 1). Procrastination in Personal Finance: Implications for Estate Planning and Retirement Satisfaction.
Sinha, P., Calfee, C. S., & Delucchi, K. L. (2021). Practitioner’s guide to latent class analysis: Methodological considerations and common pitfalls. Critical Care Medicine, 49(1), e63–e79. https://doi.org/10.1097/CCM.0000000000004710
Sirois, F. (2004). Procrastination and intentions to perform health behaviors: The role of self-efficacy and the consideration of future consequences. Personality and Individual Differences, 37(1), 115–128. https://doi.org/10.1016/j.paid.2003.08.005
Sirois, F. (2015). Is procrastination a vulnerability factor for hypertension and cardiovascular disease? Testing an extension of the procrastination–health model. Journal of Behavioral Medicine, 38(3), 578–589. https://doi.org/10.1007/s10865-015-9629-2
Sirois, F., & Pychyl, T. (2013). Procrastination and the priority of short-term mood regulation: Consequences for future self. Social and Personality Psychology Compass, 7(2), 115–127. https://doi.org/10.1111/spc3.12011
Sirois, F., & Pychyl, T. A. (2016). Procrastination, health, and well-being. Academic Press.
Sirois, F., Shucard, H., & Hirsch, J. (2014). Procrastination and perceptions of the future self: Implications for health and well-being. 2nd International Conference on Time Perspective, Warsaw, Poland.
Specter, M. H., & Ferrari, J. R. (2000). Focusing on the past, present, or future? Journal of Clinical Psychology, 26, 453–461.
Stead, R., Shanahan, M. J., & Neufeld, R. W. J. (2010). “I’ll go to therapy, eventually”: Procrastination, stress and mental health. Personality and Individual Differences, 49(3), 175–180. https://doi.org/10.1016/j.paid.2010.03.028
Steel, P. (2007). The nature of procrastination: A meta-analytic and theoretical review of quintessential self-regulatory failure. Psychological Bulletin, 133(1), 65. https://doi.org/10.1037/0033-2909.133.1.65
Steel, P. (2010). Arousal, avoidant and decisional procrastinators: Do they exist? Personality and Individual Differences, 48(8), 926–934. https://doi.org/10.1016/j.paid.2010.02.025
Steel, P., & Ferrari, J. (2013). Sex, Education and Procrastination: An Epidemiological Study of Procrastinators’ Characteristics from A Global Sample. European Journal of Personality, 27(1), 51–58. https://doi.org/10.1002/per.1851
Strathman, A., Gleicher, F., Boninger, D. S., & Edwards, C. S. (1994). The consideration of future consequences: Weighing immediate and distant outcomes of behavior. Journal of Personality and Social Psychology, 66(4), 742. https://doi.org/10.1037/0022-3514.66.4.742
Van Lissa, C. J., Garnier-Villarreal, M., & Anadria, D. (2024). Recommended practices in latent class analysis using the open-source r-package tidySEM. Structural Equation Modeling: A Multidisciplinary Journal, 31(3), 526–534. https://doi.org/10.1080/10705511.2023.2250920
Yu-Sung, S., & Masanao, Y. (2024). R2jags: Using r to run ’JAGS’. https://doi.org/10.32614/CRAN.package.R2jags
Zimbardo, P. G., & Boyd, J. N. (2014). Putting time in perspective: A valid, reliable individual-differences metric. In Time perspective theory; review, research and application: Essays in honor of philip g. zimbardo (pp. 17–55). Springer. https://doi.org/10.1007/978-3-319-07368-2_2
Appendix
PoLCA represents degrees of freedom (DF) as the difference between the number of unique parameters \((N)\) and the number of independent parameters, given the number of classes \(R\), the number of questions \(J\), and the number of individual items per question \(K_j\). We can represent this difference as:
\[ DF = N - \big((R - 1) + \sum^J_{j=1}(K_j - 1) \times R \big) \]
Therefore, in an \(R\)-class model with \(N = 140, J = 14, \text{ and } K_j = 7\) the resulting degrees of freedom can be represented as:
\[ \begin{align*} DF &= N - \big((R - 1) + \sum^{14}_{j=1}(7 - 1) \times R \big) \\[4pt] &= 140 - (R - 1 + 84R) \\[4pt] &= 141 - 85R \end{align*} \]
Substituting in any value \(R > 1\) where \(R \in \mathbb{N}\) results in negative degrees of freedom and an unidentifiable model. However, by trichotomizing the individual items such that \(K_j \rightarrow 3\), our degrees of freedom can be represented as:
\[ \begin{align*} DF &= N - \big((R - 1) + \sum^{14}_{j=1}(3 - 1) \times R \big) \\[4pt] &= 140 - (R - 1 + 28R) \\[4pt] &= 141 - 29R \end{align*} \]
Under this new formulation, we are now able to fit multiple latent class models with varying degrees of \(R\).